London City Airport Monitoring Data

Use the tabs below to explore information about the current and historic air pollution levels in this enterprise.
You can select another enterprise using the dropdown menu.
Use the map above to explore the monitoring sites in for this enterprise and the surrounding area. The table below shows a summary of sites within this enterprise - you can click on the site names to get more detailed information.
Active enterprise funded monitoring sites
| Monitoring Site | Ozone (O3) |
Nitrogen Dioxide (NO2) |
Sulphur Dioxide (SO2) |
Particulate Matter (PM2.5) |
Particulate Matter (PM10) |
Highest Pollution Band | Last Updated |
|---|---|---|---|---|---|---|---|
| London City Airport KGV House | n/m | 1 (1 Low) | n/m | 3 (1 Low) | 8 (1 Low) | Low (Index 1) |
31/07/2026 13:00 |
| London City Airport Newham Dockside | n/m | 2 (1 Low) | n/m | n/m | n/m | Low (Index 1) |
31/07/2026 12:00 |
» Visit the Defra UK-AIR website for details of Defra funded AURN monitoring sites
Overall Pollution Summary:
LOW ( Index 1)
LOW ( Index 1)
| Very High | 10 |
| High | 9 |
| 8 | |
| 7 | |
| Moderate | 6 |
| 5 | |
| 4 | |
| Low | 3 |
| 2 | |
| 1 |
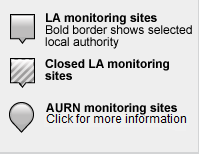
Guide to map markers:
Download uBreathe
The free app for iPhone, iPad & Android that gives you air pollution health advice - where and when you need it most
Find out more »