Birmingham Airport Monitoring Data
Use the map above to explore the monitoring sites in for this local authority and the surrounding area. The table below shows a summary of sites within this local authority - you can click on the site names to get more detailed information.
Active local authority funded monitoring sites
| Monitoring Site | Ozone (O3) |
Nitrogen Dioxide (NO2) |
Sulphur Dioxide (SO2) |
Particulate Matter (PM2.5) |
Particulate Matter (PM10) |
Highest Pollution Band | Last Updated |
|---|---|---|---|---|---|---|---|
| Birmingham Airport 2 | n/a | n/a | n/a | n/a | n/a | No Data | 15/03/2024 09:00 |
| Birmingham A4540 Roadside | 50 (2 Low) | 27 (1 Low) | n/m | 4 (1 Low) | 10 (1 Low) | Low (Index 2) |
18/04/2024 04:00 |
| Birmingham Ladywood | 61 (2 Low) | 21 (1 Low) | n/a | 3 (1 Low) | 7 (1 Low) | Low (Index 2) |
18/04/2024 04:00 |
| Oldbury Birmingham Road | n/m | 52 (1 Low) | n/m | n/m | n/m | Low (Index 1) |
18/04/2024 04:00 |
» Visit the Defra UK-AIR website for details of Defra funded AURN monitoring sites
Birmingham Airport Annual Reports
» Annual reports for Birmingham Airport.
Closed local authority funded monitoring sites
The following monitoring sites are no longer active in this local authority, but you can still access information about them by clicking on their names below.
| Monitoring Site | Date Ended |
|---|---|
| Birmingham Acocks Green [Closed] (AGRN) | 01/10/2021 |
| Birmingham Centre [Closed] (BIRM) | 14/01/2009 |
| Birmingham East [Closed] (BIR2) | 04/08/2004 |
| Birmingham Tyburn [Closed] (BIR1) | 06/06/2017 |
| Birmingham Tyburn Roadside [Closed] (BIRT) | 07/09/2016 |
LOW ( Index 2)
| Very High | 10 |
| High | 9 |
| 8 | |
| 7 | |
| Moderate | 6 |
| 5 | |
| 4 | |
| Low | 3 |
| 2 | |
| 1 |
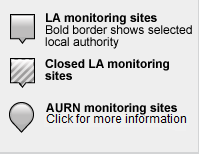
Guide to map markers:
Download uBreathe
The free app for iPhone, iPad & Android that gives you air pollution health advice - where and when you need it most
Find out more »